Yesterday this blog's headline was "The Fed Hikes Tonight. The Market Already Voted." That turned out to be exactly right — and exactly wrong about where the pain would land. The Fed hiked, unanimously, as 92% of fed funds futures expected. The hike itself moved nothing. What moved everything was what came twenty-two minutes later.
“Yesterday this blog's headline was "The Fed Hikes Tonight.”
The Decision: Unanimous, Priced, and Beside the Point
On Wednesday the FOMC raised the federal funds target range by 25 basis points to 3.75%–4.00% — the first increase since July 2023, after nine months on hold. The vote was 12-0. Three members had dissented in July wanting a hike then; none dissented now. Governor Waller, who had talked dovish between meetings, fell in line.
Markets had done the Fed's work for it. Hike odds had climbed from 44% on August 7 to 58% after the August jobs print, 89% after the hot CPI, and 92-93% going into the decision. The bond market — as OnePoint's Peter Boockvar put it — "adjusted interest rates first and all the Fed did was follow."
So the 2:00 p.m. statement was a non-event. Treasuries actually rallied briefly: the 10-year fell 3.8bp to 4.958%, the 30-year dropped 4.7bp. The relief of a central bank that had finally stopped pretending oil at $105 was transitory.
Then Kevin Warsh sat down at the press conference table.
The Press Conference: Where the Tape Turned
"I'm not in the forward guidance business," Warsh said — and then delivered guidance tougher than the dots. His read on summer inflation: the readings do not tell me that underlying trends have meaningfully improved. He framed the hike as a "partial withdrawal of accommodative policy."
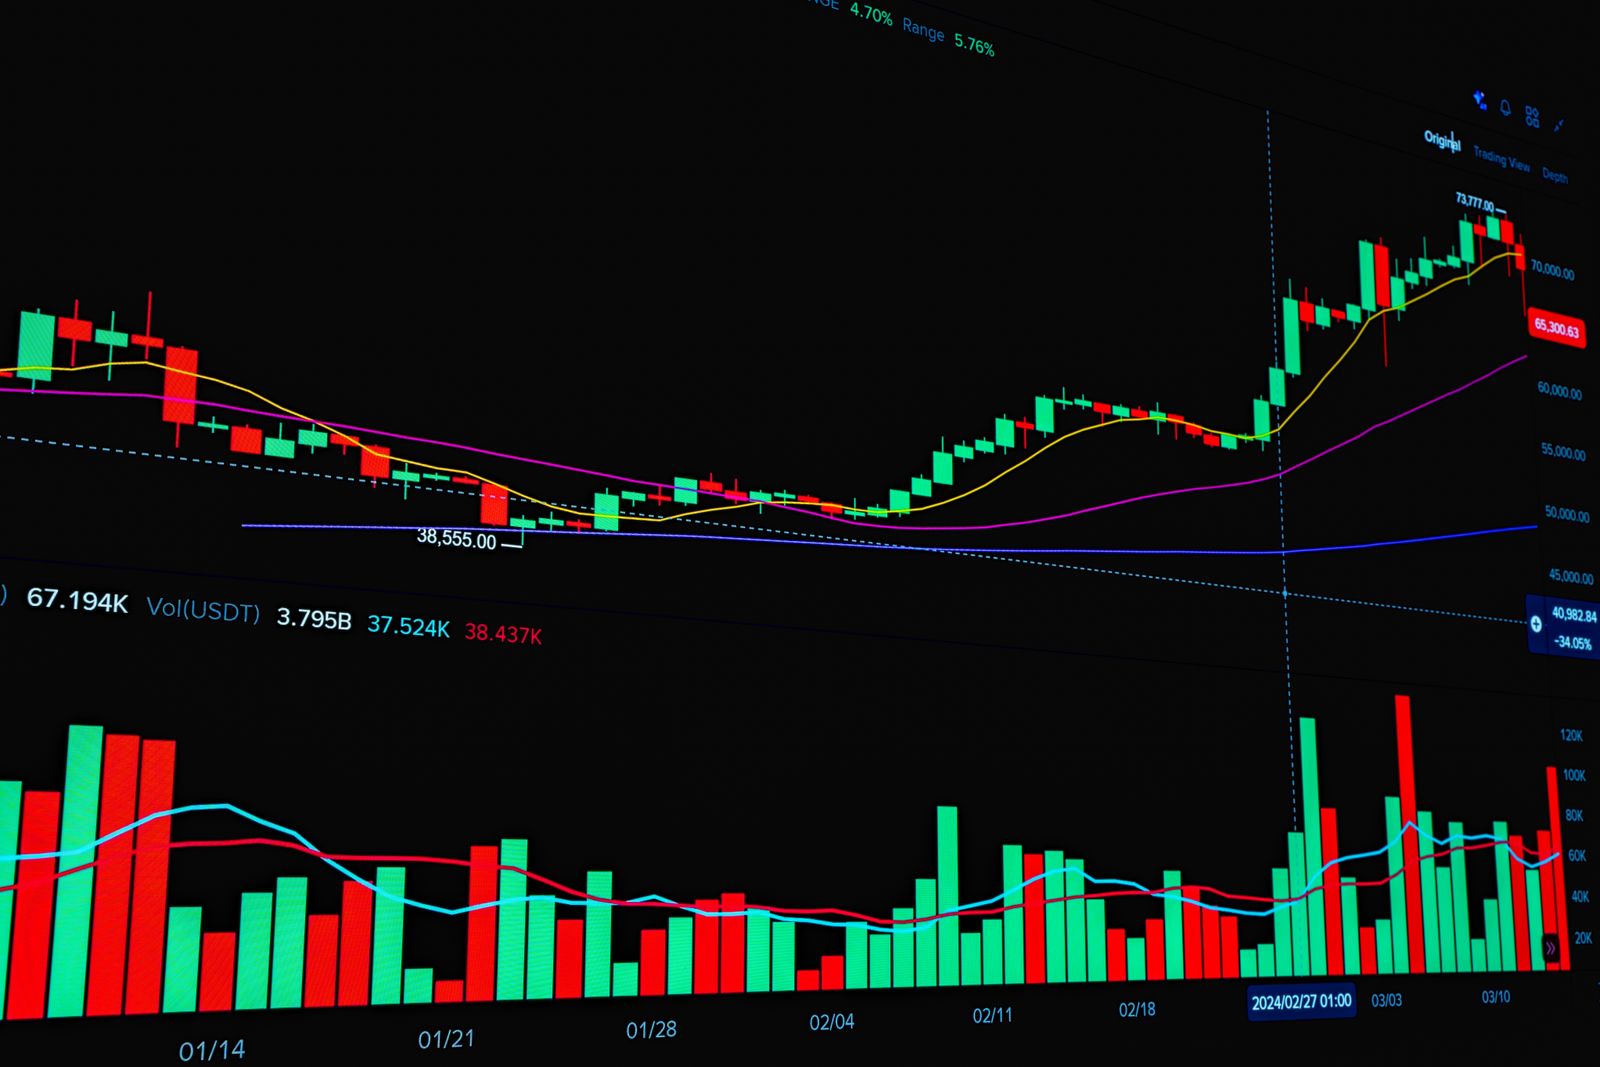
Everything reversed while he was still talking. The 2-year, which had eased on the decision, spiked more than 12bp off its lows, closing at 4.725% — highest since July 2024. The 10-year clawed back above 5% and closed at 5.003%, its highest close since July 2007 — nineteen years. Stocks faded from green to red in real time: the Dow fell 631 points (-1.21%), the S&P 500 -0.45%, the Nasdaq flat (-0.01%) as semiconductors absorbed the financials' losses.
Note the shape of that move: the short end jumped (+6.5bp on the 2-year), the long end barely budged (-1.7bp on the 30-year). A bear flattener. The market decided the Fed is behind on near-term policy but refused to give back its term premium at the long end — fiscal deficits, issuance, and oil are still there. ING's house view: 5.25% on the 10-year is the next stop.
The Dot Plot: 16 of 18 Say "One More, Maybe Two"
The Summary of Economic Projections was the second shoe. Excluding Warsh (who still refuses to submit a dot), 18 participants penciled in year-end 2026 rates:
- 2 see the cycle ending with today's hike (3.875%)
- 12 see one more hike — the median at 4.125%
- 4 see two more — 4.375%
- Zero see cuts
That is a 30bp hawkish shift from June, when the median sat at 3.8% with the committee split between holding and one hike. The 2027 median jumped from 3.6% to 4.1% — no easing next year at all. Inflation projections were revised up: core PCE 3.4% for 2026 (from 3.3%), and the committee raised its growth forecast to 2.3% while lowering unemployment to 4.1%. Translation: this is not a Fed afraid of breaking the economy. It's a Fed with a strong economy and an inflation problem — the easy kind of hike to justify and the annoying kind to trade against.
Notably, the Fed's own dot also lifted the estimated neutral rate from 3.1% to 3.2%. Even "normal" is higher now. Markets immediately priced roughly 75bp of further tightening beyond today — OIS implies a total of ~100bp of hikes in this cycle. The December hike is the base case (October is off the table: the midterms land November 3 and no committee wants that footnote).
The Sector Tape: Energy Bought the Top of the Oil Story
Here's where yesterday's preview post got the map right and the weather wrong. The single worst sector on decision day wasn't the duration-sufferers everyone expected — it was Energy, -3.25% median, the only sector down more than 1.5% other than financials.
Three stories in that bar chart:
1. The oil de-escalation trade. Saudi Arabia announced it will restore about half the capacity of its Houthi-damaged East-West pipeline within days and full operations in six weeks, and is rerouting cargoes via Oman. Brent settled at $105.71 (-2.82%), WTI at $102.43 (-3.23%) — the sharpest drops in over three weeks. E&P names paid for it: FANG -8.0%, OXY -6.6%, COP -6.2%, EOG -5.7%. The strange ones held: refiners MPC +0.8% and VLO +1.6% rode record diesel crack spreads, and Bloom Energy — power, not oil — gained +4.1%.
2. Financials fainted despite "higher for longer." -1.57% median, the textbook wrong-side surprise. Banks normally love a steepening hike cycle; this curve flattened, deposit costs are rising, and a 2-year at 4.74% with hikes ahead means the recession-adjacent tail got fatter. HBAN -5.6%, USB -4.0%, TFC -4.0%. Fintechs took the beta: HOOD -5.5%, COIN -4.4%.
3. The AI build layer shrugged. Technology was the only meaningfully green sector (+0.08% median) and the tape inside it was violent. The optical-interconnect cluster — the plumbing of the data-center buildout — ripped: Lumentum +9.6%, Credo +7.4%, Coherent +6.9%, Astera Labs +6.6%, on a day the median large cap fell 0.61%. NVDA +0.8%, TSM +1.0%.
That contrast — oil producers dumping on pipeline headlines while optics names rip 7-10% on the same tape — is the three-layer market this blog has been tracking all week, now in its most extreme daily form. Rate-sensitivity punishes the old-economy balance sheets; the AI build layer trades on order books, not discount rates. Circular Technology's Brad Gastwirth on CNBC: the hiking cycle is "less of a concern" for hyperscalers — "I don't think this is going to derail hyperscale spending at all."
What History Says Happens Next
The obvious question for anyone holding a portfolio through this: does a hike start what it ends?
UBS went through 16 hiking cycles since 1954: the S&P 500 averaged +10.8% in the twelve months after the first hike — and did not enter a bear market within the first year of any of those cycles. Wealthguard's tighter cut (six cycles since 1994) adds the texture: stocks typically struggle for the first ~4 months post-first-hike, then recover by month five, with a median 12-month gain of 10.7%. The 1997 outlier — +42% in the year after the March '97 hike, as the internet boom outran the tightening — should be filed under "technology can win against rates for a while," which is precisely the bet the AI tape is making today.
Chatham Financial's read on the immediate transmission: front-end borrowing costs up 8-12bp, 10-year +3-5bp, high-yield all-in yields pushing past 8.25% for double-B issuers. For mid-market companies with floating-rate debt or a 2027 refinancing on the calendar, that — not the dot plot — is the number that matters. Lock fixed where you can; the Fed's own dots say "higher" rhymes with "longer."
The Bottom Line
The first hike in three years arrived on schedule and changed nothing; the dot plot and the press conference changed the year. Sixteen of eighteen officials want one more hike or two, the 10-year closed above 5% for the first time since 2007, and the market's own scoreboard — Energy -3.25% while optics names gained 7-10% on the same tape — shows an economy splitting into rate-sensitive and build-cycle-sensitive halves. History says the first hike rarely breaks a bull market; it usually just reprices who gets to stay in it.
Sources
- CNBC, "Fed rate decision September 2026: Fed hikes rates" and "Investors react to Fed hike," Sep 16, 2026 (vote details, dot distribution, UBS 16-cycle study)
- Wolf Street, "Fed Finally Hikes, Dot Plot Sees More Rate Hikes," Sep 16, 2026 (dot counts, press conference)
- InvestingLive, "Fed dot plot backs hawks as Warsh tone rattles markets," Sep 16, 2026 (median dot vs Wall Street forecasts, Goldman/AS&L divergence)
- Chatham Financial, "Fed hikes rates, keeps focus on price stability," Sep 16, 2026 (92% pre-meeting odds, curve impact, HY issuance)
- ECM Source, "Fed Hikes Rates to 4.00%: Bond Yields and Dot Plot Reaction," Sep 16, 2026 (IORB/discount window, SEP revisions, 10-year intraday range)
- Scotiabank Economics, "FOMC Hikes, Guides At Least One More To Come," Sep 16, 2026 (OIS pricing ~100bp total, longer-run rate 3.2%)
- Continuum Economics, "FOMC — Further tightening likely if data holds up," Sep 16, 2026 (2027/2028/2029 dot skews, Waller note)
- Reuters / Bloomberg / DTN, oil coverage Sep 16, 2026 (Saudi East-West pipeline restoration timeline, Brent $105.71, WTI $102.43 settlements)
- Asia Business Daily, "Fed Raises Interest Rates for First Time in Over Three Years," Sep 17, 2026 (closing equity index levels, 2Y/10Y/30Y closes)
- ING Think, "Rates Spark: US 10yr likely gets above and stays above 5%," Sep 16, 2026 (2s10s below 30bp, 5.25% target)
- Wealthguard LLC, "Historical S&P 500 Returns After Fed Hikes," Sep 9, 2026 (six-cycle post-first-hike path, 1997 outlier)
- ChartRow 500-name US large-cap board, close of Sep 16, 2026 (sector medians, single-name returns, market caps; total board cap $82.6T)